The analytics GUI is a data processing, visualization, and management tool used to research new sensor applications and troubleshoot machine train issues due to new vibration modes.
It is a project-centric GUI that allows the end user to:
- Import vibration data from ADRE 408 or other select data acquisition units;
- Organize vibration data along with it’s metadata in a hierarchical manner;
- Apply various custom algorithms and signal processing techniques;
- Create cutting edge plots showing vibration data in two and three dimensions.
The goal of this project was to:
- Simplify the process of analyzing large vibration data sets;
- Act as a test bed for developing new ways to visualize vibration;
- Act as a proof of concept for future System 1 features;
- Be simple enough for external customers to operate.
Features & Design Techniques
- GUI was written in C# and interfaces with custom MATLAB algorithms via the MATLAB Compiler Runtime.
- GUI was built using WPF and implements the Model–view–viewmodel architecture for tracking data and enabling MATLAB analytics.
- Includes an on-demand FFT function in the main project code.
- Implements an “auto-run” feature to execute a list of algorithms and intelligently select what data to plot.
- Each data project created by the GUI is saved as an XML file.
- Deployed via ClickOnce.
Responsibilities & Scope
- Requirements & architecture design
- Algorithm packaging, updating, and creation
- User interface design
- Documentation (UI manual, tutorial videos, dev wiki, code)
- Project and task/issue tracking (GitHub)
- Entire project from start to finish
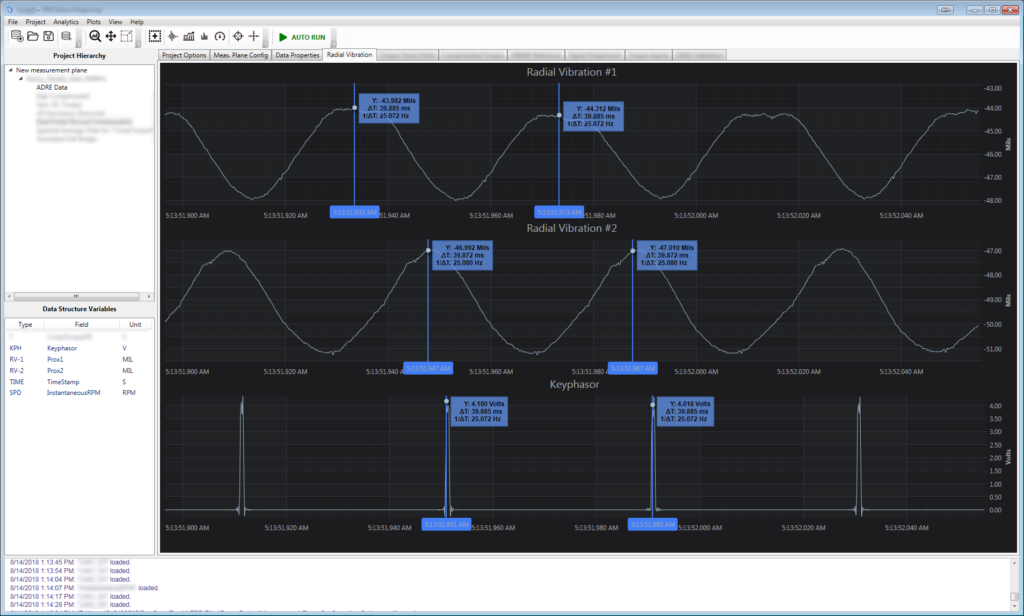
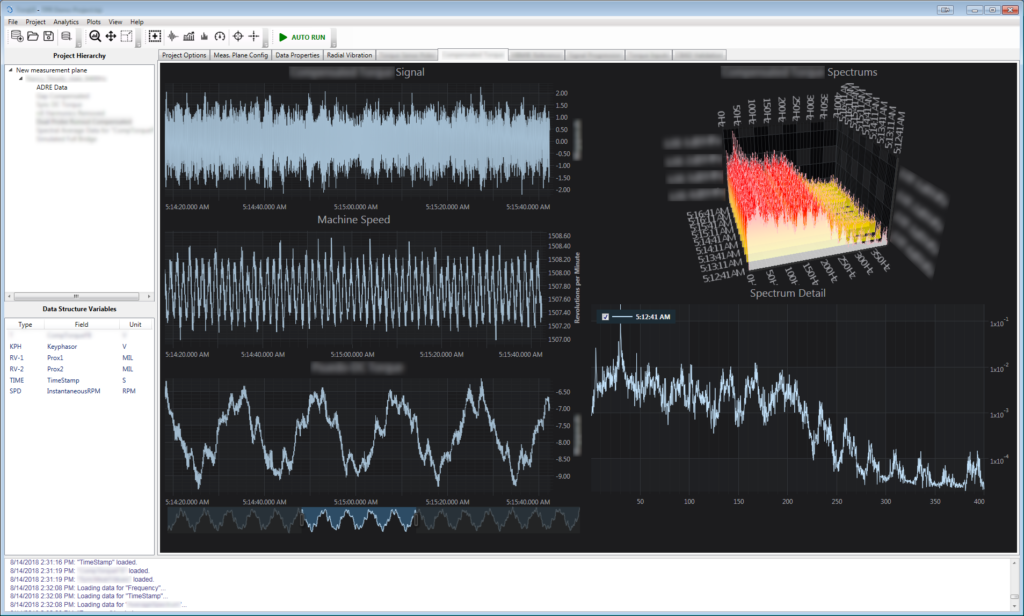
Screen Captures
Comments are closed